❌ Not for Human Consumption
●
✅ For Research Use Only
●
All products are intended strictly for laboratory research purposes only
●
❌ Not for Human Consumption
●
✅ For Research Use Only
●
All products are intended strictly for laboratory research purposes only
●

Validating NAD+ Research Compound Purity With 1H-NMR: Peak Assignments And Common Impurity Signatures

The nicotinamide ring’s H-2 singlet at approximately 9.3 ppm is the single most diagnostic peak in an NAD+ 1H-NMR spectrum and it’s the first place degradation shows up. When that singlet broadens or a satellite peak appears 0.05 ppm upfield, you’re likely looking at nicotinamide cleavage from the glycosidic bond, a hydrolysis pathway that accelerates above pH 8.0. Catching that shift early can save weeks of confounded experimental results.
This walkthrough covers the complete 1H-NMR fingerprint of NAD+ in D2O, assigns every resolvable proton environment, and catalogs the impurity signatures that distinguish a 95%+ pure research lot from one that belongs in the waste stream. If you run enzymatic assays, metabolomics experiments, or any NAD+-dependent biochemical investigation, these assignments are your quality control baseline.
DISCLAIMER: NAD+ (nicotinamide adenine dinucleotide) sold by this company is strictly for research and educational purposes only. It is not intended for human consumption, therapeutic use, or any clinical application. Nothing in this article constitutes medical advice, a health claim, or encouragement to use NAD+ outside of a controlled laboratory setting. Researchers should comply with all applicable institutional, local, and federal regulations when handling research compounds.
Why 1H-NMR beats HPLC alone for NAD+ QC
HPLC with UV detection at 260 nm remains the workhorse purity method for nucleotide-based compounds. It separates NAD+ from NMN, ADP-ribose, nicotinamide, and adenine cleanly enough for most batch release decisions. But HPLC has a blind spot that matters specifically for NAD+: it can’t distinguish the alpha and beta anomers of the nicotinamide ribose, and it struggles to resolve NAD+ from NADH when NADH is present below roughly 2-3%.
1H-NMR solves both problems. The anomeric proton H-1” of the nicotinamide riboside appears as a doublet near 6.02 ppm for the beta-NAD+ form and shifts to approximately 5.85 ppm for the alpha anomer. Since only beta-NAD+ is biologically active in most enzymatic contexts, researchers running sirtuins, PARPs, or dehydrogenase assays need this distinction. HPLC won’t give it to you.
NADH contamination is equally straightforward by NMR. The reduced nicotinamide ring loses its aromatic character entirely, producing a new set of olefinic protons between 2.7 and 6.4 ppm that are absent in the oxidized form. Even 0.5% NADH stands out clearly against the NAD+ baseline.
Neither method replaces the other. Together, they give you quantitative purity (HPLC) and structural confirmation with anomer and redox-state resolution (NMR).
Complete 1H-NMR Peak Assignments For NAD+ In D2O
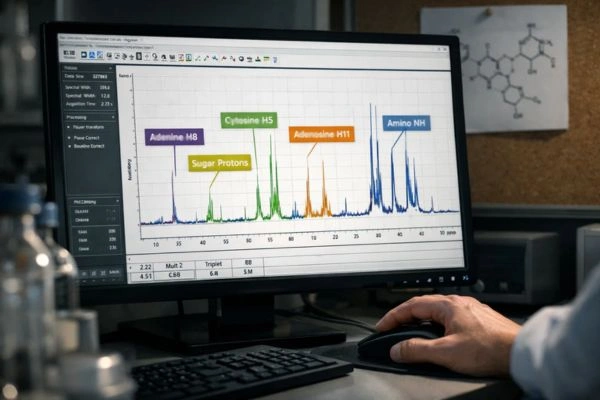
NAD+ contains 27 non-exchangeable protons spread across four structural domains: the nicotinamide ring, the adenine ring, the nicotinamide riboside, and the adenosine riboside. In D2O at 25°C and pH approximately 7.0 (uncorrected meter reading), the spectrum resolves into several distinct regions.
Aromatic Region (7.9-9.4 ppm)
This is the identity-confirming zone. The nicotinamide H-2 proton resonates as a singlet near 9.32 ppm, the most downfield signal in the entire spectrum and often the sharpest peak in a clean sample. The nicotinamide H-6 proton appears as a doublet around 9.14 ppm (J approximately 6.1 Hz), while H-4 shows up near 8.83 ppm as a doublet of triplets. The H-5 nicotinamide proton resonates around 8.18 ppm and frequently overlaps with adenine H-8, which appears near 8.47 ppm as a singlet. Adenine H-2 gives a singlet at approximately 8.24 ppm.
Getting a clean integration of the adenine H-2 and H-8 singlets relative to the nicotinamide protons serves as a quick stoichiometry check. The theoretical ratio is 1:1:1:1 across H-2(nic), H-6(nic), H-2(ade), H-8(ade). Deviations beyond roughly 5% suggest either impurity overlap or degradation.
Anomeric Region (5.8-6.2 ppm)
Two doublets dominate here. The nicotinamide ribose H-1” appears near 6.02 ppm (J approximately 5.5 Hz), and the adenosine ribose H-1′ shows up around 5.98 ppm (J approximately 5.8 Hz). These can partially overlap depending on field strength. At 400 MHz, separation is often marginal; at 600 MHz, they typically resolve completely. The coupling constants matter, they confirm the beta-glycosidic linkage in both ribose units.
Ribose Proton Region (3.9-4.6 ppm)
This is a crowded zone. Eight ribose ring protons (H-2′, H-3′, H-4′, H-2”, H-3”, H-4”) and four H-5’/H-5” methylene protons all land between 3.9 and 4.6 ppm. Full assignment here typically requires 2D experiments, COSY at minimum, and HSQC if you need carbon correlation. For routine purity assessment, though, the envelope shape matters more than individual assignments. A clean NAD+ lot produces a characteristic multiplet pattern in this region. Unexpected singlets or sharp doublets that break the envelope pattern are impurity flags.
The Water-Adjacent Region (3.0-3.9 ppm)
Mostly featureless for pure NAD+ in D2O, this region becomes important when checking for buffer-derived or solvent impurities. Tris buffer gives a singlet near 3.50 ppm. Glycerol (a common stabilizer additive) produces multiplets between 3.55 and 3.78 ppm. If your supplier ships NAD+ lyophilized from a buffer solution, residual buffer signals will appear here.
Five Impurity Signatures Every Researcher Should Recognize
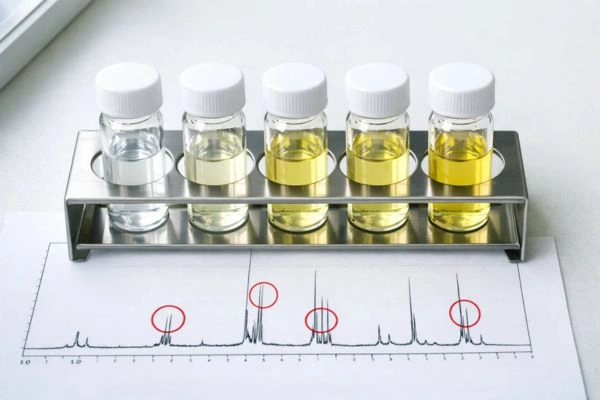
Knowing what pure NAD+ looks like is half the problem. Knowing what contaminants look like is the other half. These are the five most common impurity signatures in commercial NAD+ research lots, ranked by frequency of occurrence based on published quality assessments and our own internal QC observations.
1. Free nicotinamide (hydrolysis product)
This is the most common degradation product, period. Nicotinamide released by glycosidic bond hydrolysis produces three characteristic signals: a singlet near 8.71 ppm (H-2), a doublet of doublets near 8.58 ppm (H-6), and a multiplet centered around 7.50 ppm (H-5). That 7.50 ppm signal is the giveaway, pure NAD+ has nothing in the 7.2-7.8 ppm window. Any peak in that region means hydrolysis has occurred. Even trace nicotinamide at the 0.3-0.5% level is detectable because the 7.50 ppm multiplet sits in a clean spectral window with no NAD+ overlap.
2. Nicotinamide mononucleotide (NMN)
NMN is both a synthetic precursor and a degradation intermediate. Its aromatic protons are nearly identical to NAD+ because the nicotinamide ring environment barely changes. The key differentiator is the anomeric region: NMN’s H-1′ doublet shifts to approximately 5.95 ppm and its ribose protons redistribute slightly in the 4.0-4.4 ppm envelope. If your aromatic integrations look correct but the anomeric region shows extra doublet character, suspect NMN.
3. ADP-ribose (ADPR)
When NAD+ hydrolyzes at the nicotinamide-ribose bond, the other fragment is ADP-ribose. Its adenine protons overlap directly with NAD+ (same chemical shifts within 0.02 ppm), making the aromatic region useless for ADPR detection. Instead, look at the anomeric region: ADPR’s free ribose H-1 (the end formerly bonded to nicotinamide) resonates as a pair of signals near 5.40 ppm for the alpha and beta pyranose/furanose forms. This 5.3-5.5 ppm region is unoccupied in pure NAD+ spectra. Peaks there mean ADPR.
4. NADH (reduced form)
NADH contamination changes the aromatic region dramatically. The nicotinamide ring protons at 9.3, 9.1, 8.8, and 8.2 ppm all vanish for the reduced form, replaced by a characteristic set: a singlet near 6.93 ppm (H-2 of the dihydronicotinamide ring) and AB-pattern doublets around 2.72 ppm (H-4 methylene protons). The adenine signals remain unchanged. If you see the NAD+ aromatic pattern plus new signals near 6.9 ppm and 2.7 ppm, you’re looking at an NAD+/NADH mixture.
Quantifying the ratio is straightforward: integrate the NAD+ H-2(nic) singlet at 9.32 ppm against the NADH H-2 singlet at 6.93 ppm. One-to-one proton count on both sides makes the math clean.
5. Adenosine or AMP
These show up as synthetic byproducts rather than degradation products. Adenosine gives a ribose H-1′ doublet at approximately 6.06 ppm, slightly downfield of the NAD+ anomeric doublets, and shifts the adenine H-8 singlet by about 0.03-0.05 ppm relative to the NAD+-bound adenine. AMP is harder to distinguish from the adenosine moiety of NAD+ by 1H alone; 31P-NMR becomes more useful for phosphorylated impurities if adenosine-derived contaminants are suspected.
Practical acquisition parameters and sample prep
Spectrometer access varies across institutions, so these recommendations target 400 MHz and above, the minimum field strength for resolving NAD+ anomeric doublets.
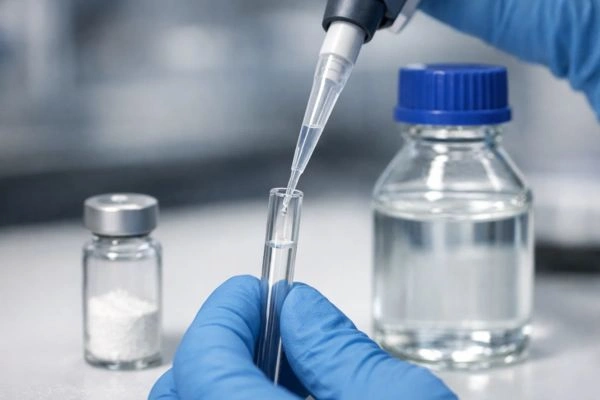
Dissolve 5-10 mg of NAD+ in 600 microliters of D2O. Don’t add a buffer unless your experiment specifically requires it; every buffer component adds peaks. If pH control is necessary, use a 50 mM deuterated phosphate buffer (potassium phosphate-d in D2O). Set the spectrometer to suppress the residual HDO signal at approximately 4.79 ppm using presaturation or excitation sculpting, the ribose proton region lives dangerously close to the water signal, and poor suppression will wipe out information between 4.4 and 5.0 ppm.
Acquire at least 64 scans with a 2-second relaxation delay for quantitative work. The nicotinamide H-2 singlet at 9.32 ppm has a T1 of roughly 3-4 seconds in D2O, so shorter relaxation delays will distort its integration relative to faster-relaxing ribose protons. For strict quantitative purity determination, bump the relaxation delay to 10 seconds (5 x T1) and accept the longer experiment time.
Temperature matters. NAD+ chemical shifts are temperature-sensitive by approximately 0.002-0.005 ppm per degree Celsius, particularly in the aromatic region. Lock your probe temperature at 25°C and let the sample equilibrate for 5 minutes before acquisition. Temperature drift during a long experiment causes artificial line broadening that mimics impurity peaks.
Setting Your Purity Threshold
A reasonable benchmark for research-grade NAD+ intended for enzymatic studies: 97% or greater purity by HPLC with less than 1% nicotinamide, less than 1% NMN, and no detectable NADH by NMR. For applications like PARP activity assays where NADH is a direct interferent, the NADH threshold should be below 0.5%, achievable with proper storage (desiccated, at or below -20°C, protected from light).
The NMR spectrum serves as the structural identity confirmation and the impurity profiling tool. HPLC provides the quantitative purity number. Neither alone is sufficient for rigorous quality control of NAD+ research materials.
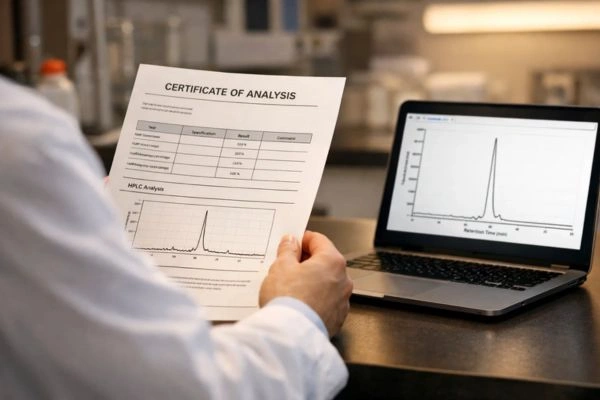
Every lot of research-grade NAD+ should arrive with a certificate of analysis that includes both chromatographic purity data and NMR spectral identity confirmation. If your supplier doesn’t provide NMR data, you should be acquiring your own spectra before using that lot in any experiment whose results you plan to publish.
A Note on What This Means for Your Research
The assays and characterization methods described here exist to help researchers verify the identity and purity of NAD+ compounds used strictly in laboratory settings. NAD+ sold through this company is a research compound, not a supplement, not a therapeutic, and not intended for human consumption under any circumstances.
Researchers bear responsibility for handling all compounds in accordance with their institution’s safety protocols, applicable regulations, and the terms under which materials are purchased. The analytical guidance in this article is educational and does not replace formal method validation for regulated applications.
If the nicotinamide H-2 singlet at 9.32 ppm is sharp, your anomeric doublets integrate correctly, and the 7.2-7.8 ppm window is silent, your NAD+ lot is clean. Run the assay.
Conclusion
Your NAD+ purity assessment comes down to three spectral checkpoints. First, confirm the nicotinamide H-2 singlet at 9.32 ppm is sharp and unsplit, broadening or satellite peaks there mean glycosidic bond hydrolysis is already underway. Second, verify the anomeric doublets near 6.02 and 5.98 ppm integrate at a 1:1 ratio with no extra doublet character suggesting NMN contamination. Third, scan the 7.2-7.8 ppm window; any signal there is free nicotinamide, full stop.
Researchers relying on HPLC alone are flying partially blind. HPLC can’t resolve alpha from beta anomers, and it misses sub-2% NADH, both of which directly compromise sirtuin, PARP, and dehydrogenase assay outcomes. Pair your chromatographic purity number with a 1H-NMR structural confirmation on every lot, no exceptions. The 30 minutes an NMR experiment costs is negligible compared to weeks spent troubleshooting artifacts from a compromised reagent.
DISCLAIMER: NAD+ (nicotinamide adenine dinucleotide) sold by this company is strictly for research and educational purposes only. It is not intended for human consumption, therapeutic use, or any clinical application. Nothing in this article constitutes medical advice, a health claim, or encouragement to use NAD+ outside of a controlled laboratory setting. Researchers should comply with all applicable institutional, local, and federal regulations when handling research compounds.
Frequently Asked Questions
Why can’t HPLC alone confirm NAD+ purity for enzymatic research?
HPLC with UV detection at 260 nm separates NAD+ from major contaminants like NMN and nicotinamide effectively, but it has two critical blind spots. It can’t distinguish beta-NAD+ (the enzymatically active anomer) from alpha-NAD+, and it fails to resolve NADH contamination below roughly 2-3%. If you’re running sirtuin or PARP assays where only beta-NAD+ is a substrate and even trace NADH interferes, HPLC data alone leaves you guessing. Pair it with 1H-NMR to get anomer resolution and redox-state confirmation in a single experiment.
What’s the fastest way to detect NAD+ degradation by NMR?
Check the 7.2-7.8 ppm window first. Pure NAD+ produces zero signals in that region. Free nicotinamide, the primary hydrolysis product from glycosidic bond cleavage, drops a distinctive multiplet at approximately 7.50 ppm. This signal is detectable down to 0.3-0.5% contamination because it sits in a completely unoccupied spectral window. If you see anything there, your lot has degraded and needs quantitative assessment before use.
What sample preparation does NAD+ 1H-NMR require?
Dissolve 5-10 mg of NAD+ in 600 microliters of D2O without buffer unless your protocol specifically demands it, every buffer component adds interfering peaks. Suppress the residual HDO signal at 4.79 ppm using presaturation or excitation sculpting, since poor water suppression destroys information in the critical 4.4-5.0 ppm ribose region. Lock probe temperature at 25°C and equilibrate for 5 minutes before acquisition. For quantitative work, use a minimum 64 scans with a relaxation delay of at least 2 seconds, extending to 10 seconds if strict integration accuracy matters.
How do you distinguish NADH contamination from NAD+ in the NMR spectrum?
NADH loses the nicotinamide ring’s aromatic character entirely, so the four signature NAD+ peaks between 8.2 and 9.3 ppm disappear for the reduced form. Instead, NADH produces a singlet near 6.93 ppm (dihydronicotinamide H-2) and AB-pattern doublets around 2.72 ppm (H-4 methylene protons). Quantification is clean, integrate the NAD+ H-2 singlet at 9.32 ppm against the NADH singlet at 6.93 ppm. Both represent exactly one proton, so the ratio gives you direct molar percentage without correction factors.
What purity specifications should researchers require for NAD+ lots?
For enzymatic studies, target 97% or higher by HPLC, with less than 1% nicotinamide, less than 1% NMN, and no NMR-detectable NADH. PARP activity assays and other NADH-sensitive applications demand a tighter NADH threshold below 0.5%, achievable only with proper storage, desiccated, at or below -20°C, light-protected. Require certificates of analysis that include both HPLC chromatographic data and NMR spectral confirmation. If a supplier provides only HPLC, acquire your own NMR spectrum before committing that lot to publishable experiments.