
Quantifying NAD+ Levels In The Lab: Analytical Methods And Detection Techniques
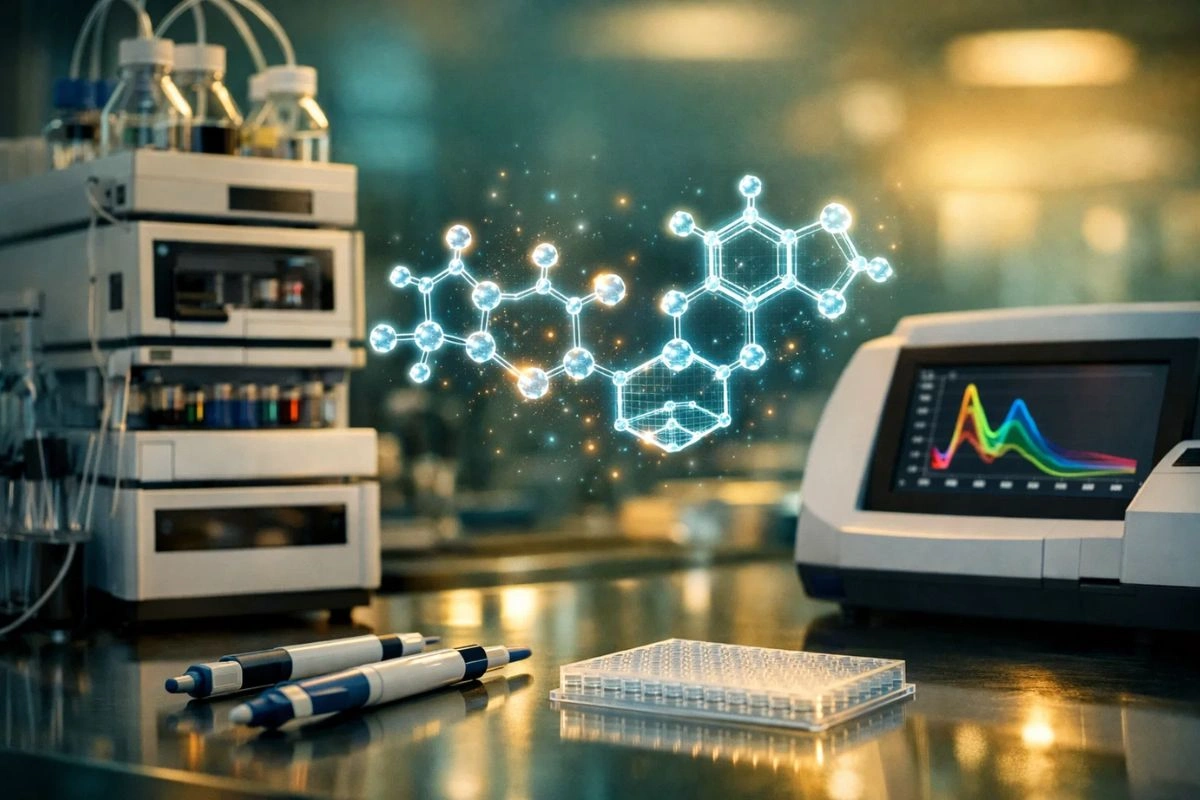
Nicotinamide adenine dinucleotide (NAD+) is one of the most extensively studied coenzymes in modern biochemistry. Its central role in redox reactions, cellular energy metabolism pathways, and as a substrate for enzymes such as sirtuins and poly(ADP-ribose) polymerases (PARPs) has made it a focal point of ongoing laboratory investigation across dozens of research disciplines.
However, the value of any NAD+-related study is only as strong as the precision with which researchers can measure and quantify it. Inaccurate quantification can compromise experimental reproducibility, skew data interpretation, and undermine the validity of published findings.
This article provides a detailed, technically oriented overview of the principal analytical methods and detection techniques used to quantify NAD+ levels in controlled laboratory settings. Whether you are establishing a new assay in your lab or evaluating which platform best suits your experimental design, this guide is written with you, the professional researcher in mind.
DISCLAIMER: The nicotinamide adenine dinucleotide (NAD+) referenced throughout this article is sold and intended strictly for in vitro research and laboratory use only. It is NOT intended for human consumption, therapeutic application, or diagnostic use. This material is intended solely for qualified researchers and academic professionals operating within appropriately equipped laboratory environments. Nothing in this article constitutes medical advice, a health claim, or an endorsement of any unapproved use.
1. Enzymatic Cycling Assays: The Workhorse of NAD+ Quantification
Overview
Enzymatic cycling assays remain among the most widely adopted techniques for measuring NAD+ in biological samples within a research context. The method exploits the ability of NAD+ to serve as a coenzyme in a coupled enzyme reaction, generating a measurable colorimetric or fluorometric signal that is directly proportional to NAD+ concentration.
How It Works
In a typical cycling assay:
- NAD+ in the sample is reduced to NADH by an enzyme such as alcohol dehydrogenase (ADH).
- NADH then reduces a tetrazolium dye (e.g., MTT or WST-8) via an electron mediator such as phenazine methosulfate (PMS).
- The resulting formazan product absorbs light at a specific wavelength, enabling spectrophotometric quantification.
Because the NAD+ is continuously regenerated during cycling, the signal is amplified over time, granting the assay high sensitivity, often in the low picomole range.
Key Considerations for Researchers
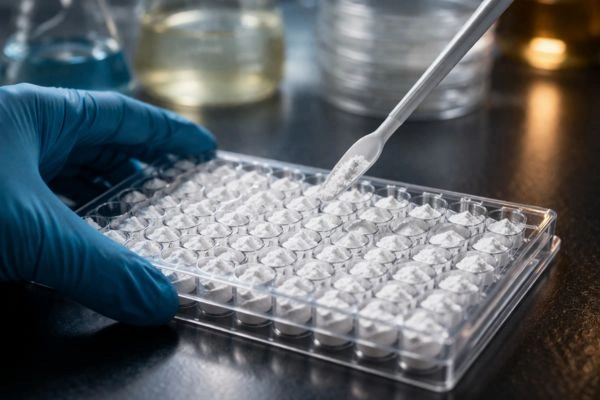
- Sample Preparation: Acid or alkaline extraction protocols must be carefully optimized. Acid extraction (using perchloric acid or HCl) preferentially preserves NAD+, while alkaline extraction preserves NADH. Cross-contamination between the oxidized and reduced forms can introduce significant measurement error.
- Specificity: Standard cycling assays measure total NAD+ and do not distinguish between free NAD+ and protein-bound NAD+ pools. Researchers studying compartmentalized NAD+ metabolism should consider supplementary approaches.
- Throughput: Plate-based cycling assays are amenable to 96-well and 384-well formats, making them suitable for high-throughput screening applications.
Recommended Applications
Enzymatic cycling assays are well-suited for comparative studies examining relative changes in NAD+ levels across experimental conditions, for example, comparing NAD+ pool sizes in treated versus untreated cell lysates in an in vitro research model.
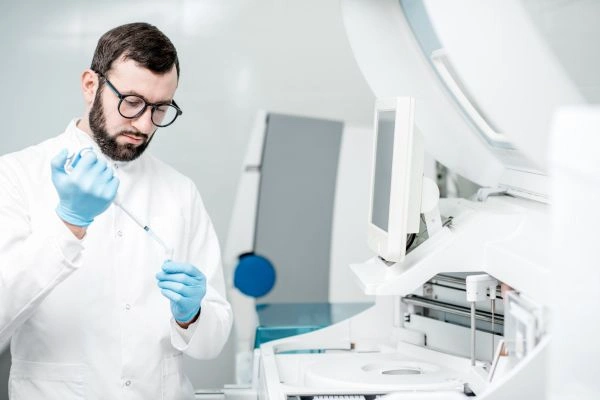
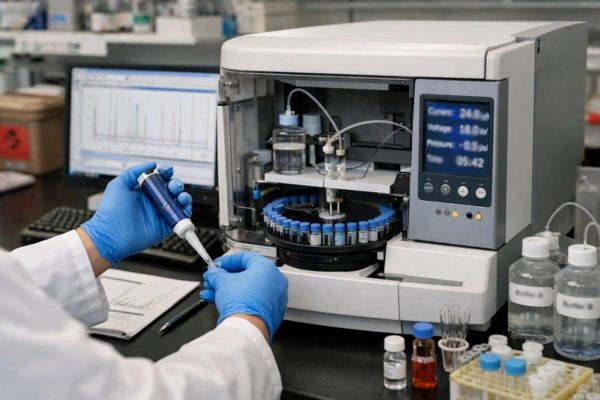
2. High-Performance Liquid Chromatography (HPLC)
Overview
HPLC is a gold-standard separation technique that offers researchers the ability to resolve NAD+ from structurally related metabolites (NADH, NADP+, NADPH, NMN, NR, and others) within a single analytical run. This makes it an invaluable tool for researchers studying the broader NAD+ metabolome.
Methodological Details
- Column Selection: Reversed-phase C18 columns are most commonly employed, though ion-pairing reagents (such as tetrabutylammonium hydrogen sulfate) may be required to achieve adequate retention of the highly polar NAD+ molecule.
- Mobile Phase: Gradient elution using phosphate or ammonium acetate buffers with methanol or acetonitrile as the organic modifier is typical.
- Detection: UV absorbance detection at 254 nm (for the adenine ring) or 340 nm (for the reduced nicotinamide ring of NADH) is standard. Fluorescence detection can also be applied for NADH with excitation/emission wavelengths of approximately 340/460 nm.
Strengths
- Simultaneous separation and quantification of multiple NAD+-related metabolites in a single run.
- High reproducibility when methods are properly validated.
- Well-established protocols are available in the published literature.
Limitations
- Relatively long run times (typically 15-45 minutes per injection).
- Lower sensitivity compared to mass spectrometry-based techniques.
- Requires careful standard curve preparation using certified reference-grade NAD+.
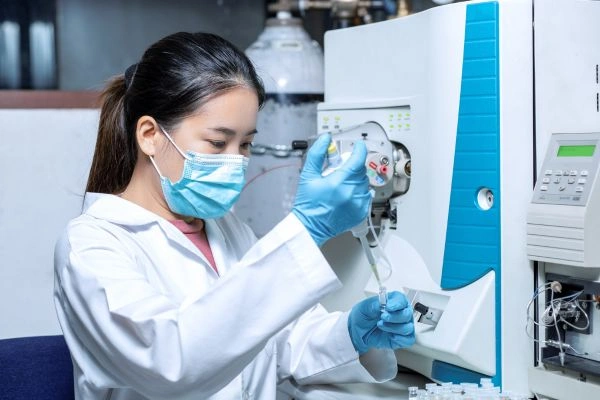
3. Liquid Chromatography – Mass Spectrometry (LC-MS/MS)
Overview
LC-MS/MS has emerged as the premier analytical platform for NAD+ quantification in research laboratories requiring the highest levels of sensitivity, specificity, and metabolite coverage. By coupling chromatographic separation with tandem mass spectrometric detection, LC-MS/MS enables unambiguous identification and quantification of NAD+ even in complex biological matrices.
Technical Approach
- Ionization: Electrospray ionization (ESI) in positive ion mode is standard for NAD+ detection. The protonated molecular ion [M+H]+ at m/z 664.1 serves as the precursor ion.
- MRM Transitions: Multiple reaction monitoring (MRM) transitions are optimized for NAD+ quantification, with characteristic product ions (e.g., m/z 428, 524, or 136 corresponding to the adenine fragment) providing high selectivity.
- Internal Standards: Isotopically labeled NAD+ (e.g., ¹³C-NAD+ or d4-NAD+) should be spiked into samples prior to extraction to correct for matrix effects and extraction variability.
- Chromatography: Hydrophilic interaction liquid chromatography (HILIC) columns are increasingly preferred over reversed-phase columns for polar metabolites like NAD+, offering superior retention without ion-pairing reagents.
Why LC-MS/MS Is Considered the Gold Standard
- Detection limits in the femtomole-to-low-picomole range.
- Ability to simultaneously quantify NAD+, NADH, NADP+, NADPH, NMN, NR, NAM, NAAD, and other pathway intermediates.
- Reduced susceptibility to matrix interference compared to optical detection methods.
- Compatibility with stable isotope tracing studies (e.g., using isotopically labeled NAD+ precursors to track flux through biosynthetic pathways).
Practical Considerations
- LC-MS/MS instrumentation requires significant capital investment and trained operators.
- Method development and validation can be time-intensive.
- Ion suppression effects in complex matrices must be carefully evaluated and controlled.
4. Capillary Electrophoresis (CE)
Overview
Capillary electrophoresis offers an alternative separation strategy based on the differential electrophoretic mobility of charged analytes. Given that NAD+ carries a net negative charge at physiological pH, it is well-suited for CE-based separation and quantification.
Detection Modes
- UV Detection: Standard CE-UV at 254 nm provides adequate sensitivity for samples with moderate NAD+ concentrations.
- CE-MS: Coupling CE with mass spectrometry combines high separation efficiency with the structural specificity of MS detection, though interface optimization can be technically demanding.
Advantages
- Extremely small sample volume requirements (nanoliter injection volumes).
- High separation efficiency (theoretical plate counts exceeding 100,000).
- Low solvent consumption relative to HPLC.
Limitations
- Lower sensitivity than LC-MS/MS for trace-level quantification.
- Limited method robustness for routine, high-throughput laboratory workflows.
- Fewer standardized protocols are available in the literature compared to HPLC.
5. Bioluminescent and Fluorescent Biosensor-Based Approaches
Overview
Genetically encoded biosensors represent a newer frontier in NAD+ detection methodology. These tools allow researchers to monitor NAD+ dynamics in living cells (in vitro cell culture models) with spatial and temporal resolution that bulk extraction methods cannot provide.
Notable Examples
- Peredox and SoNar Sensors: These are genetically encoded fluorescent sensors that respond to the NAD+/NADH ratio, enabling ratiometric imaging of the cellular redox state.
- Luciferase-Based Bioluminescent Assays: Commercially available kits exploit NAD+-dependent luciferase reactions to produce a luminescent signal proportional to NAD+ concentration. These assays are rapid, sensitive, and compatible with microplate readers.
Applications in Research
- Real-time monitoring of NAD+ dynamics in response to pharmacological or genetic perturbations in cell-based models.
- High-throughput screening of compounds that modulate NAD+ metabolism.
- Imaging subcellular NAD+ distribution (e.g., cytosolic vs. mitochondrial vs. nuclear pools).
Limitations
- Biosensors typically report the NAD+/NADH ratio rather than absolute NAD+ concentration.
- Expression levels and maturation kinetics of genetically encoded sensors can introduce variability.
- Calibration to absolute concentrations requires complementary analytical validation (e.g., LC-MS/MS).
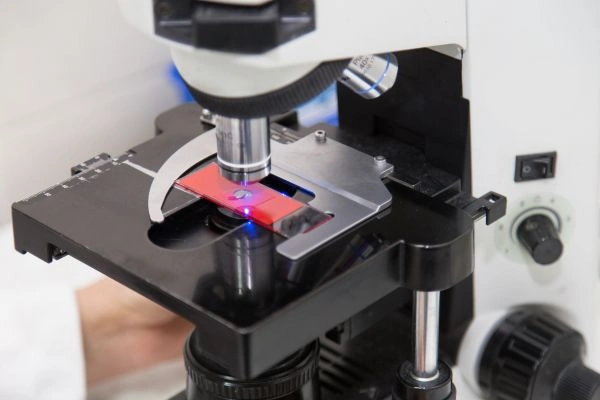
6. Nuclear Magnetic Resonance (NMR) Spectroscopy
Overview
NMR spectroscopy, particularly ³¹P-NMR, can detect and quantify NAD+ in complex mixtures without the need for chromatographic separation. The two phosphorus atoms in NAD+ produce distinct chemical shifts that can be resolved and integrated for quantification.
Use Cases
- Metabolomics Studies: ¹H-NMR and ³¹P-NMR metabolomics workflows can capture NAD+ alongside hundreds of other metabolites in a single, non-destructive measurement.
- Structural Studies: NMR can provide conformational information about NAD+ binding in enzyme active sites.
Limitations
- Sensitivity is orders of magnitude lower than mass spectrometry, requiring sample concentrations in the micromolar-to-millimolar range.
- Instrumentation costs are substantial, and magnet maintenance is ongoing.
- Not practical for trace-level quantification in limited biological samples.

Selecting the Right Method: A Decision Framework for Researchers
Choosing the appropriate NAD+ quantification method depends on your specific research question, available instrumentation, sample type, and throughput requirements. Below is a summary framework:
Enzymatic Assay
- Sensitivity: High
- Specificity: Moderate
- Throughput: High
- Cost per Sample: Low
- Metabolite Coverage: NAD+ only
- Sample Volume: Low
HPLC-UV
- Sensitivity: Moderate
- Specificity: High
- Throughput: Low–Moderate
- Cost per Sample: Moderate
- Metabolite Coverage: Multiple
- Sample Volume: Moderate
LC-MS/MS
- Sensitivity: Very High
- Specificity: Very High
- Throughput: Moderate
- Cost per Sample: High
- Metabolite Coverage: Comprehensive
- Sample Volume: Low
CE (Capillary Electrophoresis)
- Sensitivity: Moderate
- Specificity: High
- Throughput: Low
- Cost per Sample: Moderate
- Metabolite Coverage: Multiple
- Sample Volume: Very Low
Biosensors
- Sensitivity: High
- Specificity: Moderate
- Throughput: High
- Cost per Sample: Low–Moderate
- Metabolite Coverage: NAD+/NADH ratio
- Sample Volume: N/A (cell-based)
Best Practices for NAD+ Sample Handling and Preparation
Regardless of the detection method selected, researchers should observe the following best practices to ensure data integrity:
- Rapid Quenching: NAD+ is enzymatically labile. Metabolic activity must be quenched immediately upon sample collection (e.g., snap-freezing in liquid nitrogen or rapid acid extraction) to prevent post-collection degradation or interconversion.
- Temperature Control: Extracted samples should be stored at −80°C and analyzed promptly. Repeated freeze-thaw cycles should be avoided.
- Appropriate Controls: Method blanks, spiked recovery samples, and quality control standards should be included in every analytical batch.
- Reagent Quality: The use of high-purity, research-grade NAD+ reference standards is essential for accurate calibration. Poorly characterized reference materials introduce systematic bias into quantitative measurements.
Conclusion
Accurate NAD+ quantification is not merely a technical checkbox; it is the foundation upon which reliable, reproducible research is built. Each method outlined in this guide carries distinct advantages, and your choice should be driven by the specific demands of your experimental design. If your priority is high-throughput comparative screening, enzymatic cycling assays deliver speed and cost-efficiency. If your work demands comprehensive metabolite profiling with unmatched sensitivity, LC-MS/MS is the clear frontrunner. For real-time spatial and temporal resolution in living cell models, biosensor-based approaches open doors that bulk extraction methods simply cannot. Whatever platform you adopt, pair it with disciplined sample handling, rapid quenching, strict temperature control, and rigorous calibration against high-purity reference standards. Start by defining your research question, match it to the method that best serves that question, and build your workflow from there. Precision in measurement is precision in discovery.
DISCLAIMER: The nicotinamide adenine dinucleotide (NAD+) referenced throughout this article is sold and intended strictly for in vitro research and laboratory use only. It is NOT intended for human consumption, therapeutic application, or diagnostic use. This material is intended solely for qualified researchers and academic professionals operating within appropriately equipped laboratory environments. Nothing in this article constitutes medical advice, a health claim, or an endorsement of any unapproved use.
Frequently Asked Questions
Which NAD+ quantification method should I start with if my lab has limited instrumentation?
Begin with an enzymatic cycling assay. It requires only a standard microplate reader, offers high sensitivity in the low picomole range, and is compatible with 96-well and 384-well formats for efficient throughput. This makes it the most accessible entry point for labs without specialized chromatography or mass spectrometry equipment. Once you have baseline data, you can validate key findings with a more advanced platform like HPLC or LC-MS/MS through a core facility or collaboration.
How do I ensure my NAD+ measurements reflect true in-sample concentrations rather than degradation artifacts?
Prioritize rapid metabolic quenching at the moment of sample collection. Snap-freeze samples immediately in liquid nitrogen or perform rapid acid extraction using perchloric acid or HCl. Store all extracted samples at −80°C, avoid repeated freeze-thaw cycles, and include spiked recovery controls in every analytical batch. These steps collectively minimize post-collection enzymatic degradation and interconversion between NAD+ and NADH.
Can I measure both NAD+ and NADH simultaneously with a single method?
Yes, but your method selection matters. HPLC and LC-MS/MS can resolve and quantify both NAD+ and NADH (along with other related metabolites) within a single analytical run. Enzymatic cycling assays can also distinguish between them, but this requires separate acid and alkaline extractions from parallel samples. Genetically encoded biosensors like SoNar report the NAD+/NADH ratio in real time but do not provide absolute concentrations of either form independently.
Why is LC-MS/MS considered the gold standard, and when is it worth the investment?
LC-MS/MS offers femtomole-to-low-picomole detection limits, unambiguous molecular identification through MRM transitions, and the ability to profile the entire NAD+ metabolome, including NMN, NR, NAM, and NAAD, in a single run. Invest in LC-MS/MS when your research demands comprehensive pathway analysis, stable isotope tracing, or quantification in complex biological matrices where optical methods are prone to interference. If your questions center on relative NAD+ changes under controlled conditions, a simpler assay may serve you well.
What role do internal standards play, and which should I use for NAD+ analysis?
Internal standards correct for variability introduced during sample extraction, matrix effects, and instrument response drift. For LC-MS/MS workflows, spike isotopically labeled NAD+ (such as ¹³C-NAD+ or d4-NAD+) into your samples before extraction. This allows you to normalize analyte recovery across every sample in your batch. For HPLC and enzymatic assays, use certified reference-grade NAD+ to build accurate standard curves and include quality control samples at known concentrations to monitor assay performance throughout each run.