
HPLC And Mass Spectrometry Methods For Assaying Cyanocobalamin Purity In Research-Grade Compounds
Disclaimer: Cyanocobalamin products referenced in this article are intended strictly for research and educational purposes only. They are not intended for human consumption, therapeutic use, or any clinical application. Researchers should handle all compounds in accordance with institutional safety protocols and applicable regulations.
A 0.3% impurity in a cyanocobalamin reference standard can invalidate six months of binding-affinity data. That’s not hypothetical, it’s the kind of downstream failure that sends analytical chemists back to square one when they skip rigorous purity verification on incoming research-grade compounds.
Cyanocobalamin (vitamin B12, molecular weight 1,355.37 Da) presents a unique analytical challenge. Its corrin ring system, cobalt coordination center, and multiple amide side chains create a molecule with enough structural complexity that conventional single-method purity testing routinely misses degradation products hiding under the parent peak. The USP monograph specifies not less than 96.0% purity by HPLC for pharmaceutical-grade material, but research applications often demand verification well beyond that threshold.
This article breaks down the two dominant analytical approaches for cyanocobalamin purity assessment, explains where each method excels and fails, and provides actionable method parameters that research laboratories can implement or adapt for their specific assay requirements.
Why Single-Method Testing Falls Short for Cyanocobalamin
Cyanocobalamin doesn’t degrade into conveniently distinct fragments. Its primary degradation products, hydroxocobalamin, aquocobalamin, and dicyanocobinamide, share enough of the parent molecule’s chromophore that UV detection alone struggles to resolve them below the 1% level.
The corrin ring absorbs strongly at 361 nm and 550 nm, which means most degradants carry similar UV signatures. Run a standard C18 reversed-phase separation with UV detection at 361 nm and you’ll get a clean-looking chromatogram that tells you less than you think. A 2019 study published in the Journal of Pharmaceutical and Biomedical Analysis demonstrated that UV-only HPLC methods missed up to 0.8% total impurities that LC-MS subsequently identified as co-eluting species.
That gap matters. If your research depends on knowing the actual purity of the cyanocobalamin you’re working with, and it should, you need either a highly optimized HPLC method or mass spectrometric confirmation. Ideally both.
HPLC Method Parameters That Actually Resolve Cyanocobalamin Impurities
The USP method for cyanocobalamin (USP monograph, current revision) uses a fairly standard reversed-phase approach, but research labs routinely modify it for better impurity resolution. Here’s what works and what to adjust.
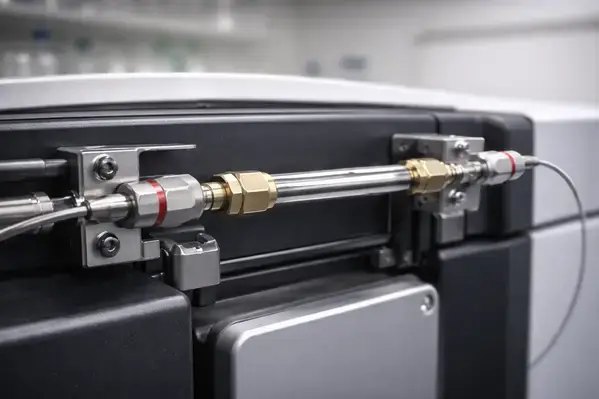
Column selection drives separation quality more than any other single variable. C18 columns with sub-2-micron particles (1.7-1.8 um) on UHPLC systems cut run times from 45 minutes to under 15 while improving peak resolution. The Waters Acquity BEH C18 (2.1 x 100 mm, 1.7 um) and Agilent ZORBAX Eclipse Plus C18 (2.1 x 100 mm, 1.8 um) both deliver baseline resolution of cyanocobalamin from its five major related substances.
For labs still running conventional HPLC, a C18 column with 3.5 um particles at 250 mm length will get the job done, just expect 35-40 minute run times.
The mobile phase composition is where most labs can immediately improve their separations. A phosphate buffer system (25 mM potassium dihydrogen phosphate, pH 3.0) paired with acetonitrile in gradient mode resolves the critical pair of cyanocobalamin and hydroxocobalamin that co-elute under isocratic conditions. The gradient should start at 5% organic, ramp to 25% over 20 minutes, then step to 60% for a column wash. That wash step isn’t optional, cyanocobalamin’s degradation products include hydrophobic species that will ghost into your next injection if you don’t flush them.
Flow rate at 0.3 mL/min for UHPLC systems (1.0 mL/min for conventional 4.6 mm ID columns) keeps backpressure manageable while maintaining separation efficiency. Column temperature at 30 degrees C stabilizes retention times that otherwise drift with ambient temperature changes, cyanocobalamin’s retention is surprisingly temperature-sensitive due to its conformational flexibility in solution.
Detection at 361 nm provides the best signal-to-noise ratio for the parent compound, but adding a second wavelength at 550 nm gives you a built-in identity confirmation. The 361/550 nm absorbance ratio for pure cyanocobalamin falls between 2.85 and 3.15. If your peak shows a ratio outside that window, you’ve got a co-elution problem regardless of what the integration report says.
Injection volume matters more than most analysts realize with cyanocobalamin. The molecule’s high molar absorptivity (epsilon = 30,800 L/mol-cm at 361 nm) means you can work at low concentrations – 0.1 mg/mL in water is plenty. But overloading the column by injecting high concentrations broadens the parent peak enough to swallow adjacent impurities. Keep injection volumes at 2-5 uL for UHPLC and 10-20 uL for conventional systems.
Where Mass Spectrometry Changes the Game
HPLC-UV tells you how much of your sample elutes at a given retention time with a particular UV profile. Mass spectrometry tells you what those peaks actually are. For cyanocobalamin purity work, that distinction isn’t academic, it’s the difference between reporting “99.2% purity” and knowing whether the remaining 0.8% is a harmless synthesis byproduct or a cobalt-free degradant that will behave completely differently in your assay.
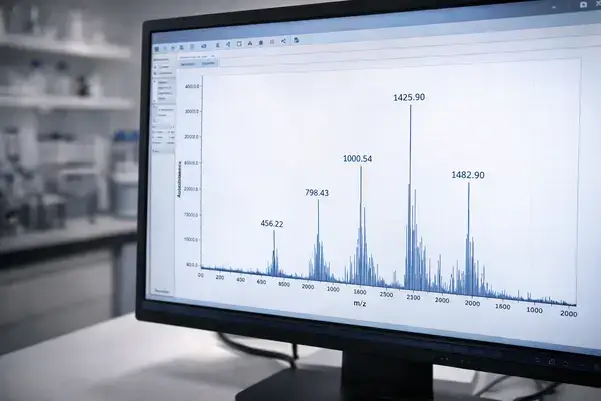
LC-MS analysis of cyanocobalamin works best with electrospray ionization in positive mode (ESI+). The molecule ionizes cleanly, producing a dominant [M+2H]2+ ion at m/z 678.3 and a [M+H]+ ion at m/z 1355.6. That doubly charged species is actually your friend, it falls in a mass range where most quadrupole and time-of-flight instruments have excellent sensitivity and resolution.
Three MS configurations see regular use in cyanocobalamin purity work, each with distinct trade-offs.
Single quadrupole LC-MS is the workhorse option. Pair it with your existing HPLC separation and you get mass-based peak identification at modest instrument investment. The limitation is resolution, a single quad can’t distinguish cyanocobalamin (1355.37 Da) from a hypothetical degradant at 1355.40 Da. For most purity applications, that’s acceptable because the chromatographic separation handles the heavy lifting and the MS simply confirms peak identity.
Triple quadrupole (QqQ) in MRM mode drops detection limits by roughly two orders of magnitude compared to single quad full-scan mode. If you’re hunting for trace-level impurities below 0.05%, MRM transitions from m/z 678.3 to fragment ions at m/z 359.1 (corrin ring fragment) and m/z 147.1 (nucleotide loop fragment) provide the specificity to quantify individual degradants even when they co-elute chromatographically. The downside is that you need to know what you’re looking for, MRM is a targeted technique that won’t flag unexpected impurities.
High-resolution MS (HRMS) using Q-TOF or Orbitrap platforms is where untargeted impurity profiling becomes possible. Mass accuracy below 5 ppm lets you assign molecular formulas to unknown peaks, and MSn fragmentation patterns can suggest structures. A Q-TOF running at 20,000 resolution can differentiate cyanocobalamin from hydroxocobalamin (delta mass of 1.0032 Da due to CN vs OH ligand exchange) even if they co-elute completely. Orbitrap systems at 100,000+ resolution take this further, resolving isotope fine structure that confirms the presence of cobalt in an unknown peak’s molecular formula.
The practical recommendation for most research labs: run your HPLC-UV method for routine purity checks, then confirm with LC-MS (any configuration) when you’re qualifying a new lot of research material or when UV results look suspicious.
Sample Preparation: the Step That Wrecks the Most Results
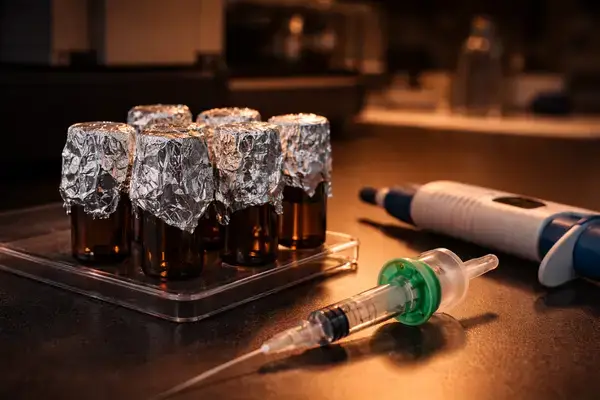
Cyanocobalamin is photolabile. That single fact causes more failed assays than every instrument parameter combined.
Exposure to ambient fluorescent lighting for as little as 30 minutes degrades cyanocobalamin measurably. The photolysis products include hydroxocobalamin and aquocobalamin, which means your “impurity profile” may actually be a sample handling artifact rather than a reflection of the compound’s true purity.
Wrap sample vials in aluminum foil. Prepare solutions under amber lighting or in a room with UV-filtered fixtures. Use amber HPLC vials. This isn’t excessive caution, it’s the minimum standard for getting meaningful results.
Dissolve cyanocobalamin in water (HPLC grade or better) at your target concentration and analyze within 4 hours. Solutions stored at 4 degrees C in amber glass are stable for approximately 48 hours, but freshly prepared standards always yield tighter replicates.
Filtration through 0.22 um PVDF or nylon membranes is fine. Avoid cellulose acetate filters, cyanocobalamin binds to them at low concentrations, which introduces a negative bias that increases as your working concentration decreases.
Method Validation Considerations for Research Applications
Research labs aren’t bound by ICH Q2(R2) validation requirements the way pharmaceutical QC labs are, but skipping validation entirely undermines confidence in your purity data. A fit-for-purpose approach covers the essentials without the regulatory overhead.
At minimum, establish these parameters for your cyanocobalamin purity method. Linearity across 50-150% of your working concentration (typically 0.05-0.15 mg/mL) with an r-squared of 0.999 or better. Precision demonstrated by six replicate injections at 100% concentration with RSD below 1.0% for the main peak. Specificity confirmed by demonstrating resolution greater than 1.5 between cyanocobalamin and its nearest-eluting impurity.
For the MS component, verify that your ionization conditions produce consistent response factors across the concentration range and that matrix effects from your sample solvent don’t suppress or enhance ionization of minor impurities relative to the parent compound.
System suitability criteria should include plate count (not less than 5,000 for the cyanocobalamin peak on a 100 mm column), tailing factor (not more than 1.5), and injection-to-injection retention time reproducibility (RSD below 0.5%).
Interpreting Results and Reporting Purity
Here’s where many researchers make an avoidable mistake: they report “HPLC purity” as a single number without specifying the method, detection wavelength, or whether that number represents area percent or mass percent.
Area percent by UV detection overestimates cyanocobalamin purity whenever impurities have lower molar absorptivity at the detection wavelength, which is the case for most cobalt-free degradation products. The offset is typically 0.3-0.8% between UV area percent and true mass percent as determined by MS-calibrated methods.
Report purity with the method attached. “99.1% by HPLC-UV at 361 nm (area normalization)” communicates something very different from “99.1% by LC-HRMS (mass-calibrated).” Both numbers are valid. Neither is complete without the qualifier.
For certificate of analysis review on incoming research-grade cyanocobalamin, look for these specifics: the HPLC method reference (USP or in-house), detection wavelength, whether related substances were individually identified or lumped as “total impurities,” and whether any MS confirmation was performed. A CoA that simply states “purity: >98%” without method details is insufficient for rigorous research work.
Building a Practical Testing Workflow
For research labs running cyanocobalamin assays regularly, the most efficient workflow layers methods by purpose.
Start with HPLC-UV as your screening method for every incoming lot. If purity by area normalization exceeds your acceptance criterion (typically 97% or higher for research-grade material) and the impurity profile matches your reference chromatogram, accept the lot for routine use. Total run time including column equilibration is about 25 minutes on UHPLC.
Escalate to LC-MS when any of these conditions apply: UV purity falls below your threshold, an unfamiliar peak appears in the impurity region, the 361/550 nm absorbance ratio falls outside the 2.85-3.15 window, or you’re qualifying a new supplier’s material for the first time.
Reserve HRMS for investigational work, identifying unknown degradants, characterizing forced-degradation samples, or troubleshooting unexpected assay results. This isn’t a routine tool for most labs, but having access to it (even through a contract testing organization) fills the gap that targeted methods can’t cover.
Document your standard operating procedures for both sample handling and data analysis. Cyanocobalamin’s photosensitivity means your SOP needs specific light-protection steps that wouldn’t apply to most other analytes. Build those into the method rather than relying on analyst awareness.
What Separates Reliable Cyanocobalamin Purity Data From Guesswork
Most analytical failures with cyanocobalamin don’t stem from bad instruments. They stem from treating a photolabile, structurally complex 1,355 Da molecule like a simple small-molecule assay. The labs producing defensible purity data share three habits: they protect samples from light at every step, they monitor the 361/550 nm absorbance ratio as a co-elution check, and they confirm questionable results with mass spectrometry rather than re-running the same UV method and hoping for different numbers.
Implement the tiered workflow outlined above, UHPLC-UV for screening, LC-MS for qualification, HRMS for investigation, and you’ll catch the 0.3-0.8% impurity gap that UV-only methods routinely miss. That gap is the difference between publishing data you can stand behind and retracting it later. Build the analytical rigor into your process now. Your downstream research depends on it.
Cyanocobalamin is sold strictly for research purposes only and is not intended for human consumption.
FAQs
What HPLC column is best for separating cyanocobalamin from its related impurities?
Sub-2-micron C18 columns on UHPLC systems deliver the strongest results. Specifically, columns like the Waters Acquity BEH C18 (2.1 x 100 mm, 1.7 um) resolve cyanocobalamin from its five major related substances, including the critical hydroxocobalamin pair, in under 15 minutes. Labs running conventional HPLC should use a C18 column with 3.5 um particles at 250 mm length, though run times extend to 35-40 minutes. Column selection has more impact on separation quality than any other single method variable, so don’t default to whatever C18 column is sitting in the drawer. Match particle size and dimensions to your system’s pressure capabilities for the best impurity resolution. Cyanocobalamin referenced here is for research use only and not for human consumption.
Why does UV detection alone miss cyanocobalamin impurities?
Cyanocobalamin’s primary degradation products, hydroxocobalamin, aquocobalamin, and dicyanocobinamide, share the parent molecule’s corrin ring chromophore. That structural similarity means they absorb at nearly identical UV wavelengths, making them difficult to distinguish from the main peak at 361 nm. Research published in the Journal of Pharmaceutical and Biomedical Analysis found that UV-only HPLC methods missed up to 0.8% total impurities that LC-MS subsequently identified as co-eluting species. Monitoring a second wavelength at 550 nm and checking the 361/550 nm absorbance ratio (expected range: 2.85-3.15 for pure cyanocobalamin) helps flag co-elution problems, but mass spectrometric confirmation remains the definitive approach for accurate impurity profiling. Cyanocobalamin is intended strictly for laboratory research and educational purposes.
Which mass spectrometry technique works best for cyanocobalamin purity analysis?
It depends on what you’re trying to accomplish. Single quadrupole LC-MS handles routine peak identification at the lowest instrument overhead, sufficient for confirming that your major peak is actually cyanocobalamin and not a co-eluting degradant. Triple quadrupole (QqQ) in MRM mode drops detection limits by roughly 100-fold, making it the right choice for quantifying trace impurities below 0.05% using transitions from m/z 678.3 to fragment ions at 359.1 and 147.1. High-resolution MS (Q-TOF or Orbitrap) is the tool for untargeted profiling, identifying unknown degradants by molecular formula assignment at sub-5 ppm mass accuracy. Most research labs should run LC-MS confirmation when qualifying new lots and reserve HRMS for investigational troubleshooting. All cyanocobalamin discussed is for research purposes only and not intended for human consumption.
How should cyanocobalamin samples be prepared to avoid degradation during analysis?
Light protection is non-negotiable. Cyanocobalamin undergoes measurable photolysis after just 30 minutes of exposure to standard fluorescent laboratory lighting, producing hydroxocobalamin and aquocobalamin artifacts that contaminate your impurity profile. Wrap all sample vials in aluminum foil, prepare solutions under amber lighting or UV-filtered fixtures, and use amber HPLC vials for autosampler loading. Dissolve in HPLC-grade water at 0.1 mg/mL and analyze within 4 hours of preparation. If storage is necessary, solutions held at 4 degrees C in amber glass remain stable for approximately 48 hours. One often-overlooked detail: avoid cellulose acetate syringe filters, which bind cyanocobalamin at low concentrations and introduce negative bias. Use 0.22 um PVDF or nylon membranes instead. Cyanocobalamin is for research and educational use only and is not for human consumption.
What method validation parameters should research labs establish for cyanocobalamin purity testing?
Research labs aren’t held to ICH Q2(R2) pharmaceutical validation standards, but a fit-for-purpose approach protects data integrity without regulatory overhead. Establish linearity across 50-150% of your working concentration (0.05-0.15 mg/mL) targeting r-squared of 0.999 or better. Demonstrate precision with six replicate injections at 100% concentration, requiring RSD below 1.0% for the main peak. Confirm specificity by verifying resolution greater than 1.5 between cyanocobalamin and its nearest-eluting impurity. For system suitability, set minimum plate count at 5,000 for the cyanocobalamin peak, tailing factor not more than 1.5, and retention time RSD below 0.5% across replicate injections. These parameters take one to two days to establish and save weeks of troubleshooting questionable results downstream. Cyanocobalamin is sold for research purposes only and is not intended for human consumption.